Download the notebook here!
Interactive online version: ![]()
Online Retail Simulator
This notebook provides a high-level overview of the Online Retail Simulator and sets the context for the causal analyses that follow.
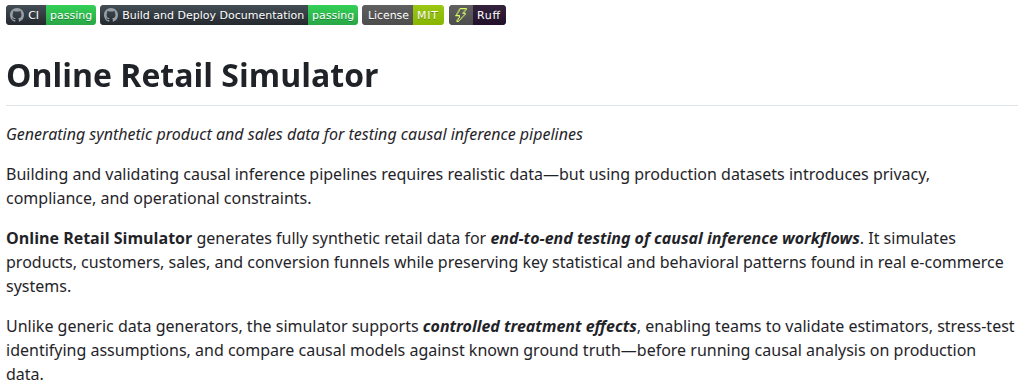
The simulator operates in three phases. First, the products phase generates a product catalog with key attributes such as category and price tier. Second, the product_details phase enriches each product with detailed content including brand names, titles, descriptions, and feature lists. Third, the metrics phase simulates sales transactions with realistic temporal patterns and conversion metrics. You can choose between rule-based generation, which is deterministic and interpretable, and synthesizer-based generation, which learns patterns from your own data. An enrichment layer then allows you to inject known treatment effects—such as a quantity boost or a gradual rollout—so you can validate whether your causal models recover the true effect size.
Simulate Product Data
We start by installing the package directly from its GitHub repository. Then we are ready to import the Online Retail Simulator just as any other package.
[1]:
# Standard Library
import inspect

# Third-party packages
from IPython.display import Code
import pandas as pd

from online_retail_simulator import enrich, simulate, load_job_results

# Local imports
from support import (
    plot_revenue_by_category,
    plot_daily_metrics_trend,
    plot_conversion_funnel,
    plot_treatment_effect,
    display_product_details,
)
Let’s start by simulating 100 products. The configuration is defined using YAML and organizes the three-phase simulation process.
The STORAGE section specifies where to save output files.
The RULE section contains two subsections—PRODUCTS and METRICS—each defining a FUNCTION to call and a PARAMS subsection for function-specific parameters like num_products, date_start, date_end, and seed.
The PRODUCT_DETAILS section specifies the FUNCTION used to enrich products with additional content.
[2]:
! cat "config_simulation.yaml"
STORAGE:
  PATH: output

RULE:
  PRODUCTS:
    FUNCTION: simulate_products_rule_based
    PARAMS:
      num_products: 100
      seed: 42

  METRICS:
    FUNCTION: simulate_metrics_rule_based
    PARAMS:
      date_start: "2024-11-01"
      date_end: "2024-11-30"
      sale_prob: 0.7
      seed: 42

PRODUCT_DETAILS:
  FUNCTION: simulate_product_details_mock
To understand how the simulation functions work under the hood, you can explore their source code directly. Python’s inspect module lets you view the implementation right inside the notebook, or you can browse the source files on GitHub (products,
product_details, metrics) or the API documentation (products,
product_details, metrics).
[3]:
from online_retail_simulator.simulate.products_rule_based import simulate_products_rule_based

Code(inspect.getsource(simulate_products_rule_based), language="python")
[3]:
def simulate_products_rule_based(config: Dict) -> pd.DataFrame:
    """
    Generate synthetic products (rule-based).
    Args:
        config: Complete configuration dictionary
    Returns:
        DataFrame of products
    """
    params = config["RULE"]["PRODUCTS"]["PARAMS"]
    num_products, seed = params["num_products"], params["seed"]

    if seed is not None:
        random.seed(seed)
    products: List[Dict] = []
    for i in range(num_products):
        category = random.choice(_CATEGORIES)
        price_min, price_max = _PRICE_RANGES[category]
        price = round(random.uniform(price_min, price_max), 2)
        products.append(
            {
                "product_identifier": generate_random_product_identifier(),
                "category": category,
                "price": price,
            }
        )
    return pd.DataFrame(products)
[4]:
from online_retail_simulator.simulate.product_details_mock import simulate_product_details_mock

Code(inspect.getsource(simulate_product_details_mock), language="python")
[4]:
def simulate_product_details_mock(
    products_df: pd.DataFrame,
    seed: int = None,
    prompt_path: str = None,
    treatment_mode: bool = False,
) -> pd.DataFrame:
    """Generate mock product details (rule-based).

    Args:
        products_df: Input products with product_identifier, category, price
        seed: Random seed for reproducibility
        prompt_path: Ignored for mock backend (accepted for API compatibility)
        treatment_mode: If True, generate "improved" product details

    Returns:
        DataFrame with added title, description, brand, features
    """
    # prompt_path is ignored for mock backend but accepted for API compatibility
    _ = prompt_path

    rng = random.Random(seed)
    results = []

    for product in products_df.to_dict("records"):
        category = product.get("category", "General")
        data = _get_mock_data(category, treatment_mode=treatment_mode)

        # Preserve existing brand if present, otherwise generate new one
        brand = product.get("brand") or rng.choice(data["brands"])
        adj = rng.choice(data["adjectives"])
        features = rng.sample(data["features"], min(4, len(data["features"])))

        title = f"{brand} {adj} {category} Item"
        if treatment_mode:
            description = f"Premium {category.lower()} product with exceptional quality. {features[0]}. {features[1]}."
        else:
            description = f"Quality {category.lower()} product for everyday use. {features[0]}. {features[1]}."

        result = {
            **product,
            "title": title,
            "description": description,
            "brand": brand,
            "features": features,
        }
        result["quality_score"] = calculate_quality_score(result)
        results.append(result)

    return pd.DataFrame(results)
Calling simulate("config_simulation.yaml") triggers a three-phase data generation process. First, it reads and validates the YAML configuration, then runs the products phase to create a product catalog with the specified number of products, assigning each a unique identifier, category, and price. Second, it runs the product_details phase to enrich each product with brand names, titles, descriptions, and feature lists. Third, it runs the metrics phase, simulating a shopper
conversion funnel (impressions, visits, cart additions, orders, and revenue) for each product across the defined date range. The function writes the generated DataFrames to disk and returns a JobInfo object that tracks where the results are stored—which you then pass to load_job_results() to retrieve the data.
The products data represents the catalog of items available for sale. Each product starts with core attributes—a unique product_identifier, category (such as Electronics, Clothing, or Books), brand, and price—which are then enriched with product_details including title, description, and features. These attributes influence the simulated sales behavior—for example, higher-priced items may have different conversion patterns than low-cost products, and categories
can exhibit distinct purchasing dynamics.
[5]:
job_info = simulate("config_simulation.yaml")

results = load_job_results(job_info)
products = results["products"]
metrics = results["metrics"]
Products
[6]:
products.head()
[6]:
| product_identifier | category | price | title | description | brand | features | quality_score | |
|---|---|---|---|---|---|---|---|---|
| 0 | BRPOIG8F1C | Clothing | 19.63 | ClassicWear Comfortable Clothing Item | Quality clothing product for everyday use. Wri... | ClassicWear | ['Wrinkle resistant', 'Quick dry', 'Machine wa... | 0.824 |
| 1 | BO6B9M80O2 | Electronics | 185.86 | NexGen Advanced Electronics Item | Quality electronics product for everyday use. ... | NexGen | ['Long battery life', 'Bluetooth connectivity'... | 0.850 |
| 2 | BAK1VRJNVG | Sports & Outdoors | 245.69 | QualityFirst Essential Sports & Outdoors Item | Quality sports & outdoors product for everyday... | QualityFirst | ['Easy to use', 'Long lasting', 'Durable const... | 0.893 |
| 3 | BWWQC38HYF | Clothing | 85.29 | ClassicWear Casual Clothing Item | Quality clothing product for everyday use. Wri... | ClassicWear | ['Wrinkle resistant', 'Stretch fit', 'Machine ... | 0.801 |
| 4 | BXMECOSFOG | Sports & Outdoors | 251.38 | PrimePick Classic Sports & Outdoors Item | Quality sports & outdoors product for everyday... | PrimePick | ['Durable construction', 'High quality materia... | 0.929 |
Let’s examine a single product to understand the structure better.
[7]:
example_product = products.iloc[0]
example_product
[7]:
product_identifier                                           BRPOIG8F1C
category                                                       Clothing
price                                                             19.63
title                             ClassicWear Comfortable Clothing Item
description           Quality clothing product for everyday use. Wri...
brand                                                       ClassicWear
features              ['Wrinkle resistant', 'Quick dry', 'Machine wa...
quality_score                                                     0.824
Name: 0, dtype: object
This product has a unique product_identifier for tracking, belongs to the category Clothing with a price of $19.63, and includes enriched content: a brand name (StyleFit), a descriptive title, a marketing-focused description, and a list of product features. These attributes combine catalog characteristics with content details to create a realistic product listing.
Metrics
[8]:
metrics.sort_values(["product_identifier", "date"]).head()
[8]:
| product_identifier | category | price | title | description | brand | features | quality_score | date | impressions | visits | cart_adds | ordered_units | revenue | |
|---|---|---|---|---|---|---|---|---|---|---|---|---|---|---|
| 24 | B07UQNUPQZ | Electronics | 948.1 | SmartLife Pro Electronics Item | Quality electronics product for everyday use. ... | SmartLife | ['Bluetooth connectivity', 'LCD display', 'Voi... | 0.817 | 2024-11-01 | 25 | 4 | 0 | 0 | 0.0 |
| 124 | B07UQNUPQZ | Electronics | 948.1 | SmartLife Pro Electronics Item | Quality electronics product for everyday use. ... | SmartLife | ['Bluetooth connectivity', 'LCD display', 'Voi... | 0.817 | 2024-11-02 | 25 | 3 | 0 | 0 | 0.0 |
| 224 | B07UQNUPQZ | Electronics | 948.1 | SmartLife Pro Electronics Item | Quality electronics product for everyday use. ... | SmartLife | ['Bluetooth connectivity', 'LCD display', 'Voi... | 0.817 | 2024-11-03 | 10 | 1 | 0 | 0 | 0.0 |
| 324 | B07UQNUPQZ | Electronics | 948.1 | SmartLife Pro Electronics Item | Quality electronics product for everyday use. ... | SmartLife | ['Bluetooth connectivity', 'LCD display', 'Voi... | 0.817 | 2024-11-04 | 25 | 3 | 0 | 0 | 0.0 |
| 424 | B07UQNUPQZ | Electronics | 948.1 | SmartLife Pro Electronics Item | Quality electronics product for everyday use. ... | SmartLife | ['Bluetooth connectivity', 'LCD display', 'Voi... | 0.817 | 2024-11-05 | 25 | 3 | 0 | 0 | 0.0 |
Let’s examine a single metric record to understand the conversion funnel structure.
[9]:
example_metric = metrics.iloc[0]
example_metric
[9]:
product_identifier                                           BRPOIG8F1C
category                                                       Clothing
price                                                             19.63
title                             ClassicWear Comfortable Clothing Item
description           Quality clothing product for everyday use. Wri...
brand                                                       ClassicWear
features              ['Wrinkle resistant', 'Quick dry', 'Machine wa...
quality_score                                                     0.824
date                                                         2024-11-01
impressions                                                          10
visits                                                                1
cart_adds                                                             0
ordered_units                                                         0
revenue                                                             0.0
Name: 0, dtype: object
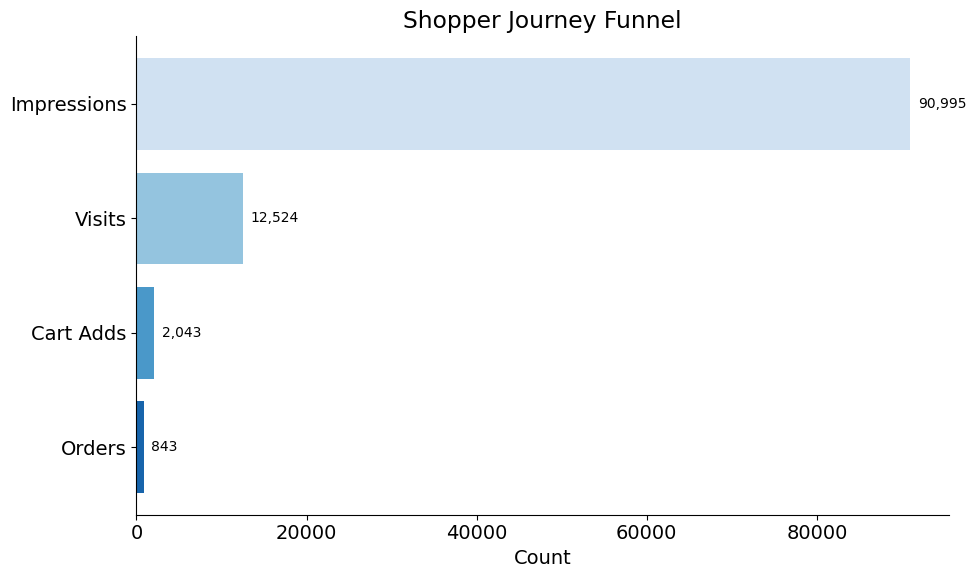
This metric record tracks the shopper journey as a conversion funnel for one product on one date. It includes product_identifier, category, and date for identification, then follows shoppers through each stage: impressions (product shown), visits (clicked to view), cart_adds (added to cart), ordered_units (purchased), and revenue (total sales). This funnel structure captures how shoppers drop off at each stage of the purchase process.
Exploration
Now that we understand the structure of both DataFrames, let’s explore the generated data through visualizations and summary statistics.
Questions
What is the date range?
How many categories?
What is the total revenue?
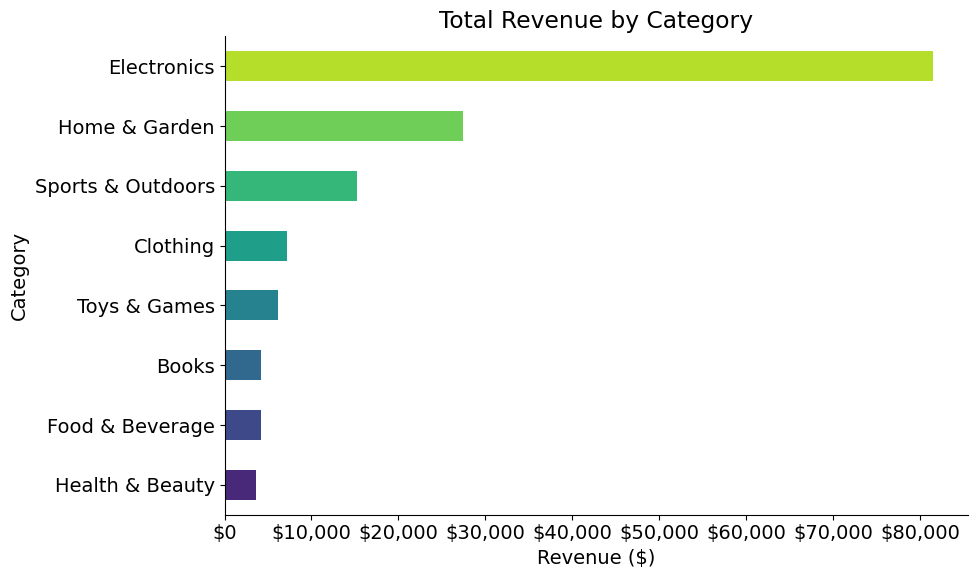
How is revenue distributed across product categories?
[10]:
category_revenue = metrics.groupby("category")["revenue"].sum().sort_values()
plot_revenue_by_category(category_revenue)
[11]:
Code(inspect.getsource(plot_revenue_by_category), language="python")
[11]:
def plot_revenue_by_category(category_revenue):
    """
    Plot horizontal bar chart of revenue by category.

    Parameters
    ----------
    category_revenue : pandas.Series
        Series with category names as index and revenue values.
    """
    fig, ax = plt.subplots(figsize=(10, 6))
    category_revenue.plot(kind="barh", ax=ax, color=sns.color_palette("viridis", len(category_revenue)))
    ax.set_xlabel("Revenue ($)")
    ax.set_ylabel("Category")
    ax.set_title("Total Revenue by Category")
    ax.xaxis.set_major_formatter(plt.FuncFormatter(lambda x, _: f"${x:,.0f}"))
    plt.tight_layout()
    plt.show()
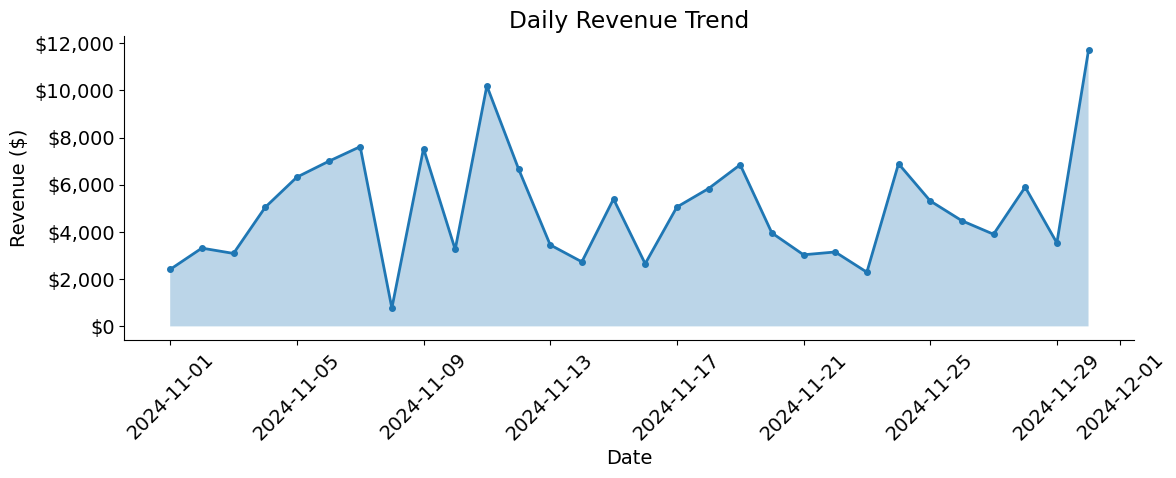
How do metrics vary over time?
[12]:
daily_metrics = metrics.groupby("date").agg({"ordered_units": "sum", "revenue": "sum"}).reset_index()
plot_daily_metrics_trend(daily_metrics)
How do shoppers move through the purchase journey?
[13]:
plot_conversion_funnel(metrics)
Questions
What fraction of impressions become visits?
What fraction of visits add to cart?
What fraction of cart adds become orders?
What is the overall conversion rate?
Explore Product Data
Vibe coding is a development style where you describe what you want in natural language and let AI assistants generate the code. Rather than manually writing every line, you focus on asking the right questions and guiding the output. This approach accelerates exploratory data analysis, letting you iterate quickly through hypotheses without getting bogged down in syntax.
In this section, we use GitHub Copilot to generate descriptive plots on the fly. We ask a question, sketch the intent, and let Copilot fill in the details. The goal is not perfectly polished code—it’s rapid insight generation. Once we find something interesting, we can refine and formalize it later.
Revenue Analysis
Which category generates the most revenue?
What are the top 10 products by revenue?
How does daily revenue change over time?
Product Performance
Which products have the most impressions but lowest conversion?
What is the distribution of ordered units per product?
Enrich Product Data
Real-world e-commerce teams constantly face a critical question: Does improving product content quality increase sales? To help you explore this with known ground truth, the simulator lets you inject treatment effects into a subset of products starting at a specific date, creating synthetic experiments where you know the true causal impact.
The enrichment process operates through two coordinated mechanisms:
Content Enhancement: Generate upgraded product copy with premium brand positioning, compelling descriptions, and detailed feature highlights
Sales Impact: Apply the corresponding sales boost that this improved content would realistically produce
The ENRICHMENT configuration controls the treatment parameters. The effect_size controls the magnitude of the boost (0.5 = 50% increase), enrichment_fraction determines what share of products receive treatment (1.0 = 100%), and enrichment_start sets when the intervention begins. The ramp_days parameter models a gradual rollout where the effect linearly increases over the specified number of days, mimicking real-world deployment patterns.
[14]:
! cat "config_enrichment.yaml"
IMPACT:
  FUNCTION: product_detail_boost
  PARAMS:
    effect_size: 0.5
    ramp_days: 0
    enrichment_fraction: 1.0
    enrichment_start: "2024-11-15"
    seed: 42
    backend: "mock"
[15]:
from online_retail_simulator.enrich.enrichment_library import product_detail_boost

Code(inspect.getsource(product_detail_boost), language="python")
[15]:
def product_detail_boost(metrics: list, **kwargs) -> tuple:
    """
    Product detail regeneration and metrics boost for enrichment experiments.

    Selects a fraction of products for treatment, regenerates their product
    details (title, description, features) while preserving brand/category/price,
    and applies metrics boost effect.

    Args:
        metrics: List of metric record dictionaries
        **kwargs: Parameters including:
            - job_info: JobInfo for saving product artifacts (required for saving)
            - products: List of product dictionaries (required for product details)
            - effect_size: Percentage increase in ordered units (default: 0.5)
            - ramp_days: Number of days for ramp-up period (default: 7)
            - enrichment_fraction: Fraction of products to enrich (default: 0.3)
            - enrichment_start: Start date of enrichment (default: "2024-11-15")
            - seed: Random seed for product selection (default: 42)
            - prompt_path: Path to custom prompt template file (optional)
            - backend: Backend to use for regeneration ("mock" or "ollama", default: "mock")

    Returns:
        Tuple of (treated_metrics, potential_outcomes_df):
            - treated_metrics: List of modified metric dictionaries with treatment applied
            - potential_outcomes_df: DataFrame with Y0_revenue and Y1_revenue for all products
    """
    job_info = kwargs.get("job_info")
    products = kwargs.get("products")
    effect_size = kwargs.get("effect_size", 0.5)
    ramp_days = kwargs.get("ramp_days", 7)
    enrichment_fraction = kwargs.get("enrichment_fraction", 0.3)
    enrichment_start = kwargs.get("enrichment_start", "2024-11-15")
    seed = kwargs.get("seed", 42)
    prompt_path = kwargs.get("prompt_path")
    backend = kwargs.get("backend", "mock")
    quality_boost = kwargs.get("quality_boost", 0.0)

    if seed is not None:
        random.seed(seed)

    # 1. Save original product details
    if job_info and products:
        job_info.save_df("product_details_original", pd.DataFrame(products))

    # 2. Select treatment products
    if products:
        unique_product_ids = list(set(p.get("product_identifier", p.get("product_id")) for p in products))
    else:
        unique_product_ids = list(set(record["product_id"] for record in metrics))

    n_treatment = int(len(unique_product_ids) * enrichment_fraction)
    treatment_ids = set(random.sample(unique_product_ids, n_treatment))

    # 3. Regenerate product details for treatment products
    if products and job_info:
        updated_products = _regenerate_product_details(
            products, treatment_ids, prompt_path, backend, seed, quality_boost
        )
        job_info.save_df("product_details_enriched", pd.DataFrame(updated_products))

    # 4. Apply metrics boost effect and calculate potential outcomes
    treated_metrics = []
    potential_outcomes = {}  # {(product_id, date): {'Y0_revenue': x, 'Y1_revenue': y}}
    start_date = datetime.strptime(enrichment_start, "%Y-%m-%d")

    for record in metrics:
        record_copy = copy.deepcopy(record)
        product_id = record_copy.get("product_id", record_copy.get("product_identifier"))
        record_date_str = record_copy["date"]
        record_date = datetime.strptime(record_date_str, "%Y-%m-%d")

        is_enriched = product_id in treatment_ids
        record_copy["enriched"] = is_enriched

        # Calculate Y(0) - baseline revenue (no treatment)
        y0_revenue = record_copy["revenue"]

        # Calculate Y(1) - revenue if treated (for ALL products, with ramp-up)
        unit_price = record_copy.get("unit_price", record_copy.get("price"))
        if record_date >= start_date:
            days_since_start = (record_date - start_date).days
            ramp_factor = 1.0 if ramp_days <= 0 else min(1.0, days_since_start / ramp_days)
            adjusted_effect = effect_size * ramp_factor

            original_quantity = record_copy["ordered_units"]
            boosted_quantity = int(original_quantity * (1 + adjusted_effect))
            y1_revenue = round(boosted_quantity * unit_price, 2)
        else:
            # Before treatment start, Y(1) = Y(0)
            y1_revenue = y0_revenue

        # Store potential outcomes for ALL products
        key = (product_id, record_date_str)
        potential_outcomes[key] = {"Y0_revenue": y0_revenue, "Y1_revenue": y1_revenue}

        # Apply factual outcome (only for treated products)
        if is_enriched and record_date >= start_date:
            record_copy["ordered_units"] = boosted_quantity
            record_copy["revenue"] = y1_revenue

        treated_metrics.append(record_copy)

    # Build potential outcomes DataFrame
    potential_outcomes_df = pd.DataFrame(
        [
            {
                "product_identifier": pid,
                "date": d,
                "Y0_revenue": v["Y0_revenue"],
                "Y1_revenue": v["Y1_revenue"],
            }
            for (pid, d), v in potential_outcomes.items()
        ]
    )

    return treated_metrics, potential_outcomes_df
Calling enrich("config_enrichment.yaml", job_info) applies the treatment effect to the simulated data. The product_detail_boost() function performs two operations: first, it regenerates product details for the treatment group using treatment_mode=True (creating enhanced content with premium brand names, compelling descriptions, and specific feature highlights); second, it applies a 50% sales boost to these products starting November 15th. The function automatically saves three
artifacts: the original product details, the enhanced treatment product details, and the enriched sales data—which we can load and examine to understand both the content improvements and their impact on sales metrics.
[16]:
enriched_job = enrich("config_enrichment.yaml", job_info)
results = load_job_results(enriched_job)
Changes
[17]:
enriched = results["enriched"]
enriched.head()
[17]:
| product_identifier | category | price | title | description | brand | features | quality_score | date | impressions | visits | cart_adds | ordered_units | revenue | enriched | |
|---|---|---|---|---|---|---|---|---|---|---|---|---|---|---|---|
| 0 | BRPOIG8F1C | Clothing | 19.63 | ClassicWear Comfortable Clothing Item | Quality clothing product for everyday use. Wri... | ClassicWear | ['Wrinkle resistant', 'Quick dry', 'Machine wa... | 0.824 | 2024-11-01 | 10 | 1 | 0 | 0 | 0.0 | True |
| 1 | BO6B9M80O2 | Electronics | 185.86 | NexGen Advanced Electronics Item | Quality electronics product for everyday use. ... | NexGen | ['Long battery life', 'Bluetooth connectivity'... | 0.850 | 2024-11-01 | 25 | 4 | 0 | 0 | 0.0 | True |
| 2 | BAK1VRJNVG | Sports & Outdoors | 245.69 | QualityFirst Essential Sports & Outdoors Item | Quality sports & outdoors product for everyday... | QualityFirst | ['Easy to use', 'Long lasting', 'Durable const... | 0.893 | 2024-11-01 | 10 | 1 | 0 | 0 | 0.0 | True |
| 3 | BWWQC38HYF | Clothing | 85.29 | ClassicWear Casual Clothing Item | Quality clothing product for everyday use. Wri... | ClassicWear | ['Wrinkle resistant', 'Stretch fit', 'Machine ... | 0.801 | 2024-11-01 | 10 | 1 | 0 | 0 | 0.0 | True |
| 4 | BXMECOSFOG | Sports & Outdoors | 251.38 | PrimePick Classic Sports & Outdoors Item | Quality sports & outdoors product for everyday... | PrimePick | ['Durable construction', 'High quality materia... | 0.929 | 2024-11-01 | 25 | 4 | 0 | 0 | 0.0 | True |
The enriched dataset contains the same metrics as before (impressions, visits, cart_adds, ordered_units, revenue) but now includes an enriched column indicating which products received the treatment. Products with enriched=True have enhanced content and boosted sales metrics starting from the treatment date.
[18]:
example_enriched = enriched.iloc[0]
example_enriched
[18]:
product_identifier                                           BRPOIG8F1C
category                                                       Clothing
price                                                             19.63
title                             ClassicWear Comfortable Clothing Item
description           Quality clothing product for everyday use. Wri...
brand                                                       ClassicWear
features              ['Wrinkle resistant', 'Quick dry', 'Machine wa...
quality_score                                                     0.824
date                                                         2024-11-01
impressions                                                          10
visits                                                                1
cart_adds                                                             0
ordered_units                                                         0
revenue                                                             0.0
enriched                                                           True
Name: 0, dtype: object
This record shows all the sales funnel metrics plus the enriched indicator. The treatment assignment is random but deterministic (controlled by the seed parameter), allowing us to create a reproducible experiment where we know the ground truth effect size.
The enrichment process modifies both sales metrics and product content. Let’s compare the original and enhanced product details to see the transformation.
[19]:
control_products = results["product_details_original"]
control_example = control_products.iloc[0]

display_product_details(control_example, "CONTROL GROUP (Original Content)")
======================================================================
CONTROL GROUP (Original Content)
======================================================================
Brand:       ClassicWear
Title:       ClassicWear Comfortable Clothing Item
Description: Quality clothing product for everyday use. Wrinkle resistant. Quick dry.
Features:    ['Wrinkle resistant', 'Quick dry', 'Machine washable', 'Stretch fit']
[20]:
treatment_products = results["product_details_enriched"]
treatment_example = treatment_products.iloc[0]

display_product_details(treatment_example, "TREATMENT GROUP (Enhanced Content)", add_newline=True)
======================================================================
TREATMENT GROUP (Enhanced Content)
======================================================================
Brand:       ClassicWear
Title:       ClassicWear Luxurious Clothing Item
Description: Premium clothing product with exceptional quality. Easy-care machine washable. Permanent wrinkle-free technology.
Features:    ['Easy-care machine washable', 'Permanent wrinkle-free technology', 'Rapid-dry technology', '4-way stretch comfort']
Questions
What differences do you notice in brand names?
How do the titles differ between control and treatment?
What makes the treatment description more compelling?
How are the features enhanced in the treatment version?
Impact
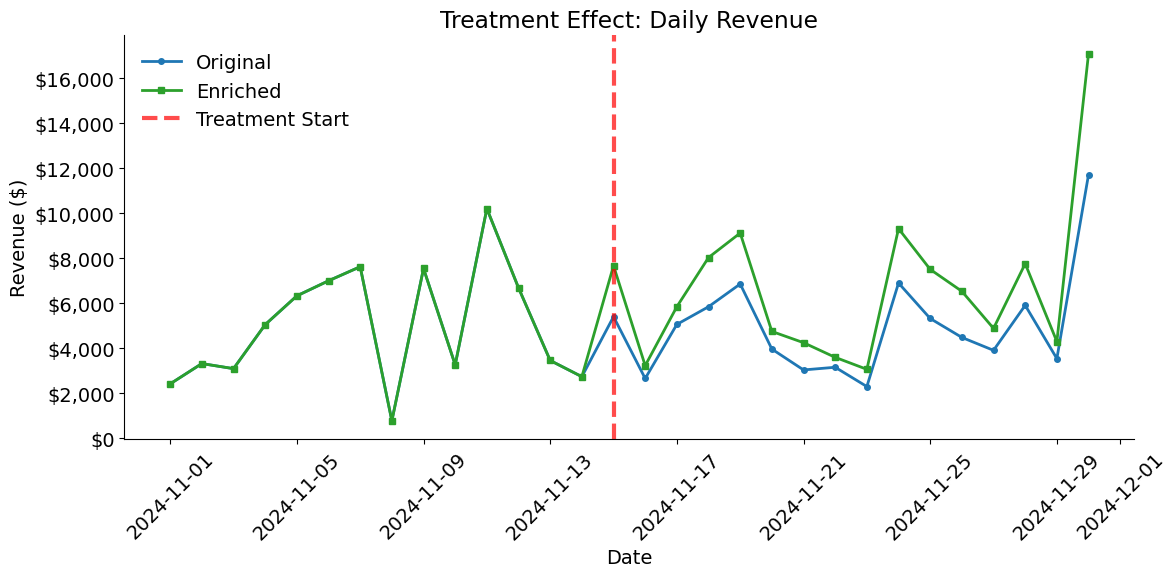
The treatment effect visualization compares daily revenue between the original and enriched datasets. Before the treatment start date, the lines should overlap perfectly. After November 15th, the enriched dataset should show higher revenue due to the 50% boost applied to all products.
[21]:
plot_treatment_effect(metrics, enriched, "2024-11-15")