Download the notebook here!
Interactive online version: ![]()
A/A Testing
Before trusting a measurement model with real treatment effects, we need to confirm it behaves correctly when there is no effect. An A/A test assigns treatment labels randomly with no actual intervention — the true treatment effect is 0 by construction. Any model applied to this data should recover an estimate close to 0.
This notebook answers two questions:
Model swappability — Given the same A/A data, do different cross-sectional models all produce estimates near 0?
Sampling variability — Is a single estimate reliable, or do we need multiple replications to separate bias from noise?
We use a single-day simulation with random treatment labels assigned to 50% of products. The quality_boost is set to 0, so there is no real intervention.
Initial setup
[1]:
import copy
import os
from pathlib import Path

import numpy as np
import pandas as pd
import yaml
from impact_engine_measure import measure_impact, load_results
from impact_engine_measure.core.validation import load_config
from online_retail_simulator import simulate
[2]:
N_REPS = 20

output_path = Path("output/demo_aa_testing")
output_path.mkdir(parents=True, exist_ok=True)
Step 1 — Product catalog
All models will use the same product catalog.
[3]:
with open("configs/demo_model_selection_catalog.yaml") as f:
    catalog_config = yaml.safe_load(f)

tmp_catalog = output_path / "catalog_config.yaml"
with open(tmp_catalog, "w") as f:
    yaml.dump(catalog_config, f, default_flow_style=False)

catalog_job = simulate(str(tmp_catalog), job_id="catalog")
products = catalog_job.load_df("products")

print(f"Generated {len(products)} products")
products.head()
Generated 1000 products
[3]:
| product_identifier | category | price | |
|---|---|---|---|
| 0 | B1P4DZHDS9 | Electronics | 686.37 |
| 1 | B1SE4QSNG7 | Toys & Games | 80.75 |
| 2 | BXTPQIDT5C | Food & Beverage | 42.02 |
| 3 | B3F1ZMC8Q6 | Food & Beverage | 33.42 |
| 4 | B2NQRBTF0Y | Toys & Games | 27.52 |
Step 2 — Configuration
Treatment assignment is controlled by the config’s DATA.ENRICHMENT section. The product_detail_boost function randomly assigns 50% of products to treatment (enrichment_fraction: 0.5). Because quality_boost: 0.0, there is no actual effect — this is an A/A test and the true treatment effect is 0 by construction.
[4]:
config_path = "configs/demo_model_selection.yaml"
true_te = 0  # A/A design: no treatment effect by construction
[5]:
def run_with_override(base_config, measurement_override, storage_url, job_id, source_seed=None):
    """Override MEASUREMENT in base config, write temp YAML, run measure_impact().

    Optionally override the data-generating seed for Monte Carlo replications.
    Returns the full MeasureJobResult for access to both impact_results and transformed_metrics.
    """
    config = copy.deepcopy(base_config)
    config["MEASUREMENT"] = measurement_override
    if source_seed is not None:
        config["DATA"]["SOURCE"]["CONFIG"]["seed"] = source_seed

    tmp_config_path = Path(storage_url) / f"config_{job_id}.yaml"
    tmp_config_path.parent.mkdir(parents=True, exist_ok=True)
    with open(tmp_config_path, "w") as f:
        yaml.dump(config, f, default_flow_style=False)

    job_info = measure_impact(str(tmp_config_path), storage_url, job_id=job_id)
    return load_results(job_info)
[6]:
base_config = load_config(config_path)

model_overrides = {
    "Experiment (OLS)": {
        "MODEL": "experiment",
        "PARAMS": {"formula": "revenue ~ enriched + price"},
    },
    "Subclassification": {
        "MODEL": "subclassification",
        "PARAMS": {
            "treatment_column": "enriched",
            "covariate_columns": ["price"],
            "n_strata": 5,
            "estimand": "att",
            "dependent_variable": "revenue",
        },
    },
    "Nearest Neighbour Matching": {
        "MODEL": "nearest_neighbour_matching",
        "PARAMS": {
            "treatment_column": "enriched",
            "covariate_columns": ["price"],
            "dependent_variable": "revenue",
            "caliper": 0.2,
            "replace": True,
            "ratio": 1,
        },
    },
}


def extract_te(result):
    """Extract the treatment effect from a MeasureJobResult regardless of model type."""
    estimates = result.impact_results["data"]["impact_estimates"]
    model_type = result.impact_results["model_type"]
    if model_type == "experiment":
        return estimates["params"].get("enriched[T.True]", estimates["params"].get("enriched", 0))
    elif model_type == "nearest_neighbour_matching":
        return estimates["att"]
    else:
        return estimates["treatment_effect"]
Step 3 — Model swappability
We load one base config and override MEASUREMENT for each model. Each iteration writes a temporary YAML and calls measure_impact().
[7]:
model_results = {}
model_estimates = {}
mean_revenue = None

for name, measurement in model_overrides.items():
    job_id = measurement["MODEL"]
    result = run_with_override(base_config, measurement, str(output_path), job_id)
    model_results[name] = result
    model_estimates[name] = extract_te(result)
    if mean_revenue is None:
        mean_revenue = result.transformed_metrics["revenue"].mean()
    print(f"{name}: treatment effect = {model_estimates[name]:.4f}")

print(f"\nTrue effect: {true_te:.4f}")
print(f"Mean revenue: {mean_revenue:.2f}")
Experiment (OLS): treatment effect = 6.3710
Subclassification: treatment effect = 6.8515
Nearest Neighbour Matching: treatment effect = 14.1673

True effect: 0.0000
Mean revenue: 36.35
[ ]:
[ ]:
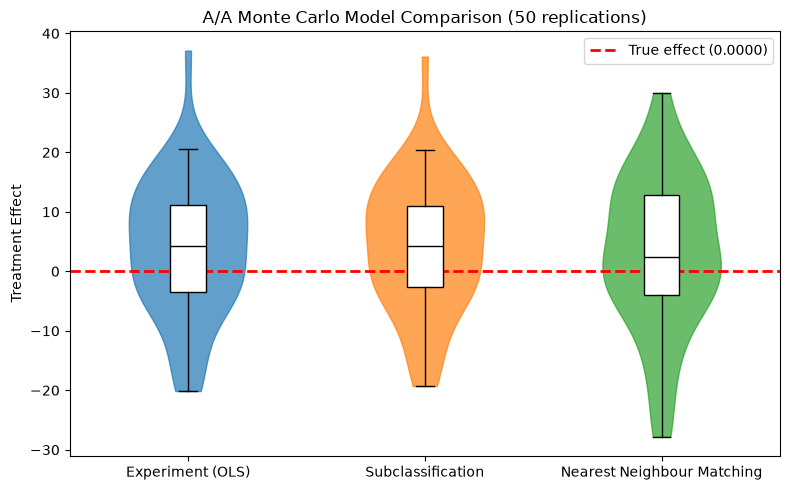
Step 4 — Monte Carlo model comparison
Step 3 used a single random seed, making it impossible to distinguish systematic bias from sampling noise. Here we run all three models across multiple replications with varying outcome seeds to obtain sampling distributions. In the A/A setting, all models should be centered around 0.
Design: We vary DATA.SOURCE.CONFIG.seed (outcome noise) while keeping DATA.ENRICHMENT.PARAMS.seed fixed (same treatment assignment). This isolates estimator sampling variability from treatment assignment variability.
[8]:
N_REPS = 50
rng = np.random.default_rng(seed=2024)
mc_seeds = rng.integers(low=0, high=2**31, size=N_REPS).tolist()
[9]:
mc_results = {name: [] for name in model_overrides}

for i, seed in enumerate(mc_seeds):
    for name, measurement in model_overrides.items():
        job_id = f"mc_{measurement['MODEL']}_rep{i}"
        result = run_with_override(
            base_config,
            measurement,
            str(output_path),
            job_id,
            source_seed=seed,
        )
        mc_results[name].append(extract_te(result))

    if (i + 1) % 5 == 0:
        print(f"Completed {i + 1}/{N_REPS} replications")

print(f"Monte Carlo simulation complete: {N_REPS} replications x {len(model_overrides)} models")
Completed 5/50 replications
Completed 10/50 replications
Completed 15/50 replications
Completed 20/50 replications
Completed 25/50 replications
Completed 30/50 replications
Completed 35/50 replications
Completed 40/50 replications
Completed 45/50 replications
Completed 50/50 replications
Monte Carlo simulation complete: 50 replications x 3 models
[10]:
from notebook_support import plot_monte_carlo_distribution

plot_monte_carlo_distribution(
    model_names=list(mc_results.keys()),
    distributions=mc_results,
    true_effect=true_te,
    ylabel="Treatment Effect",
    title=f"A/A Monte Carlo Model Comparison ({N_REPS} replications)",
)
[ ]:
[ ]: