Download the notebook here!
Interactive online version: ![]()
Parameter Sensitivity
Every measurement model has tuning parameters that influence the treatment effect estimate. Subclassification requires choosing the number of strata; nearest neighbour matching requires setting a caliper distance. How sensitive are results to these choices?
This notebook answers two questions:
Single-seed sensitivity — How does the estimate change as we sweep a tuning parameter?
Sensitivity with uncertainty — Are the observed patterns robust to sampling variation, or just noise?
We use the same A/A test design (true effect = 0) so that any deviation from 0 reflects estimator behavior, not a real treatment effect.
Initial setup
[1]:
import copy
import os
from pathlib import Path

import numpy as np
import pandas as pd
import yaml
from impact_engine_measure import measure_impact, load_results
from impact_engine_measure.core.validation import load_config
from online_retail_simulator import simulate
[2]:
# Configurable via environment variables for CI (reduced values speed up execution)
N_REPS = 25

output_path = Path("output/demo_parameter_sensitivity")
output_path.mkdir(parents=True, exist_ok=True)
Step 1 — Product catalog
All parameter sweeps use the same product catalog.
[3]:
with open("configs/demo_model_selection_catalog.yaml") as f:
    catalog_config = yaml.safe_load(f)

tmp_catalog = output_path / "catalog_config.yaml"
with open(tmp_catalog, "w") as f:
    yaml.dump(catalog_config, f, default_flow_style=False)

catalog_job = simulate(str(tmp_catalog), job_id="catalog")
products = catalog_job.load_df("products")

print(f"Generated {len(products)} products")
products.head()
Generated 1000 products
[3]:
| product_identifier | category | price | |
|---|---|---|---|
| 0 | B1P4DZHDS9 | Electronics | 686.37 |
| 1 | B1SE4QSNG7 | Toys & Games | 80.75 |
| 2 | BXTPQIDT5C | Food & Beverage | 42.02 |
| 3 | B3F1ZMC8Q6 | Food & Beverage | 33.42 |
| 4 | B2NQRBTF0Y | Toys & Games | 27.52 |
Step 2 — Configuration
[4]:
config_path = "configs/demo_model_selection.yaml"
true_te = 0  # A/A design: no treatment effect by construction

base_config = load_config(config_path)
[5]:
def run_with_override(base_config, measurement_override, storage_url, job_id, source_seed=None):
    """Override MEASUREMENT in base config, write temp YAML, run measure_impact().

    Optionally override the data-generating seed for Monte Carlo replications.
    Returns the full MeasureJobResult for access to both impact_results and transformed_metrics.
    """
    config = copy.deepcopy(base_config)
    config["MEASUREMENT"] = measurement_override
    if source_seed is not None:
        config["DATA"]["SOURCE"]["CONFIG"]["seed"] = source_seed

    tmp_config_path = Path(storage_url) / f"config_{job_id}.yaml"
    tmp_config_path.parent.mkdir(parents=True, exist_ok=True)
    with open(tmp_config_path, "w") as f:
        yaml.dump(config, f, default_flow_style=False)

    job_info = measure_impact(str(tmp_config_path), storage_url, job_id=job_id)
    return load_results(job_info)
Step 3 — Parameter sensitivity (single seed)
For a given model and data, how sensitive is the treatment effect estimate to tuning parameters? We sweep one parameter at a time while keeping everything else fixed.
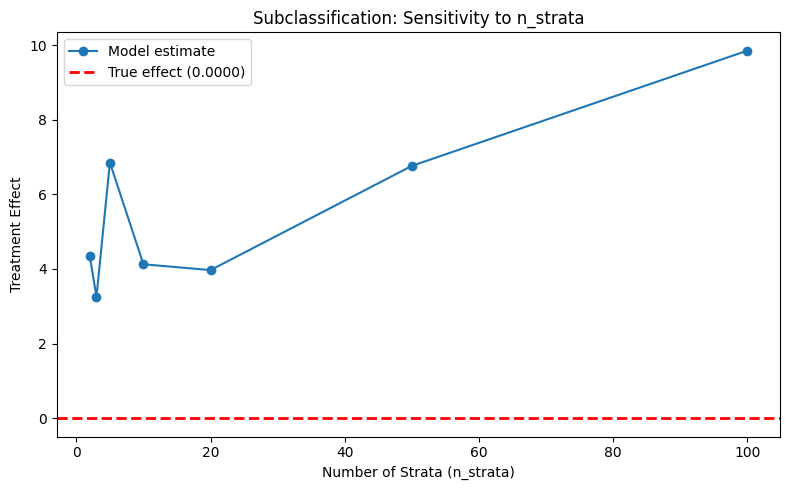
3a. Subclassification: n_strata
More strata means finer partitioning of the covariate space. This can improve precision but may leave strata without common support.
[6]:
n_strata_values = [2, 3, 5, 10, 20, 50, 100]
subclass_estimates = []
strata_used = []
strata_dropped = []
mean_revenue = None

for n in n_strata_values:
    measurement = {
        "MODEL": "subclassification",
        "PARAMS": {
            "treatment_column": "enriched",
            "covariate_columns": ["price"],
            "n_strata": n,
            "estimand": "att",
            "dependent_variable": "revenue",
        },
    }
    result = run_with_override(base_config, measurement, str(output_path), f"subclass_strata_{n}")
    estimates = result.impact_results["data"]["impact_estimates"]
    if mean_revenue is None:
        mean_revenue = result.transformed_metrics["revenue"].mean()

    subclass_estimates.append(estimates["treatment_effect"])
    strata_used.append(estimates["n_strata"])
    strata_dropped.append(estimates["n_strata_dropped"])

subclass_sensitivity = pd.DataFrame(
    {
        "n_strata (requested)": n_strata_values,
        "Strata Used": strata_used,
        "Strata Dropped": strata_dropped,
        "Treatment Effect": subclass_estimates,
        "Absolute Error": [abs(est - true_te) for est in subclass_estimates],
        "Relative Error (%)": [abs(est - true_te) / mean_revenue * 100 for est in subclass_estimates],
    }
)

print("Subclassification: n_strata Sensitivity")
print(f"Mean revenue: {mean_revenue:.2f} (used as denominator for relative error)")
print("-" * 90)
print(subclass_sensitivity.to_string(index=False, float_format=lambda x: f"{x:.4f}"))
Subclassification: n_strata Sensitivity
Mean revenue: 36.35 (used as denominator for relative error)
------------------------------------------------------------------------------------------
 n_strata (requested)  Strata Used  Strata Dropped  Treatment Effect  Absolute Error  Relative Error (%)
                    2            2               0            4.3435          4.3435             11.9484
                    3            3               0            3.1257          3.1257              8.5984
                    5            5               0            6.8515          6.8515             18.8474
                   10           10               0            4.1249          4.1249             11.3469
                   20           20               0            3.9686          3.9686             10.9170
                   50           50               0            6.7603          6.7603             18.5965
                  100          100               0            9.8478          9.8478             27.0899
[7]:
from notebook_support import plot_parameter_sensitivity

plot_parameter_sensitivity(
    param_values=n_strata_values,
    estimates=subclass_estimates,
    true_effect=true_te,
    xlabel="Number of Strata (n_strata)",
    ylabel="Treatment Effect",
    title="Subclassification: Sensitivity to n_strata",
)
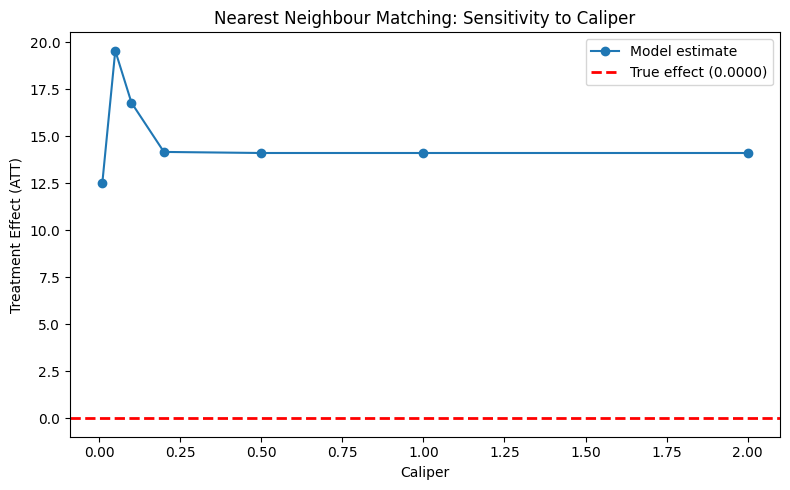
3b. Nearest neighbour matching: caliper
The caliper controls the maximum allowed distance between a treated unit and its matched control. Smaller values enforce tighter matches but may discard units, while larger values allow more matches with worse balance.
[8]:
caliper_values = [0.01, 0.05, 0.1, 0.2, 0.5, 1.0, 2.0]
matching_estimates = []
n_matched_att_list = []

for cal in caliper_values:
    measurement = {
        "MODEL": "nearest_neighbour_matching",
        "PARAMS": {
            "treatment_column": "enriched",
            "covariate_columns": ["price"],
            "dependent_variable": "revenue",
            "caliper": cal,
            "replace": True,
            "ratio": 1,
        },
    }
    result = run_with_override(base_config, measurement, str(output_path), f"matching_caliper_{cal}")
    estimates = result.impact_results["data"]["impact_estimates"]
    summary = result.impact_results["data"]["model_summary"]

    matching_estimates.append(estimates["att"])
    n_matched_att_list.append(summary["n_matched_att"])

matching_sensitivity = pd.DataFrame(
    {
        "Caliper": caliper_values,
        "N Matched (ATT)": n_matched_att_list,
        "Treatment Effect (ATT)": matching_estimates,
        "Absolute Error": [abs(est - true_te) for est in matching_estimates],
        "Relative Error (%)": [abs(est - true_te) / mean_revenue * 100 for est in matching_estimates],
    }
)

print("Nearest Neighbour Matching: Caliper Sensitivity")
print(f"Mean revenue: {mean_revenue:.2f} (used as denominator for relative error)")
print("-" * 90)
print(matching_sensitivity.to_string(index=False, float_format=lambda x: f"{x:.4f}"))
Nearest Neighbour Matching: Caliper Sensitivity
Mean revenue: 36.35 (used as denominator for relative error)
------------------------------------------------------------------------------------------
 Caliper  N Matched (ATT)  Treatment Effect (ATT)  Absolute Error  Relative Error (%)
  0.0100              900                 12.5041         12.5041             34.3969
  0.0500              978                 19.5498         19.5498             53.7784
  0.1000              990                 16.7830         16.7830             46.1674
  0.2000              996                 14.1673         14.1673             38.9720
  0.5000             1000                 14.1106         14.1106             38.8162
  1.0000             1000                 14.1106         14.1106             38.8162
  2.0000             1000                 14.1106         14.1106             38.8162
[9]:
plot_parameter_sensitivity(
    param_values=caliper_values,
    estimates=matching_estimates,
    true_effect=true_te,
    xlabel="Caliper",
    ylabel="Treatment Effect (ATT)",
    title="Nearest Neighbour Matching: Sensitivity to Caliper",
)
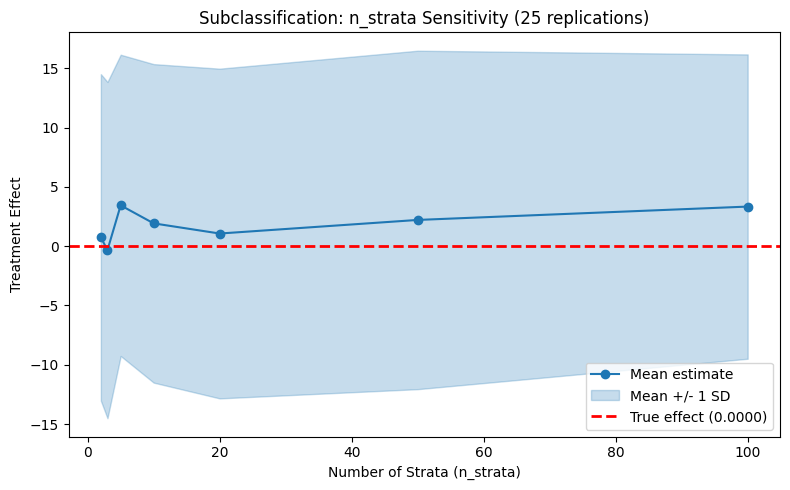
Step 4 — Parameter sensitivity with uncertainty
Step 3 showed how estimates change with tuning parameters using a single seed. Here we add uncertainty bands by running each parameter value across multiple replications. This reveals whether apparent sensitivity is real or just noise.
[10]:
rng = np.random.default_rng(seed=2024)
mc_seeds = rng.integers(low=0, high=2**31, size=N_REPS).tolist()
4a. Subclassification: n_strata
[11]:
n_strata_mc = {n: [] for n in n_strata_values}

for i, seed in enumerate(mc_seeds):
    for n in n_strata_values:
        measurement = {
            "MODEL": "subclassification",
            "PARAMS": {
                "treatment_column": "enriched",
                "covariate_columns": ["price"],
                "n_strata": n,
                "estimand": "att",
                "dependent_variable": "revenue",
            },
        }
        result = run_with_override(
            base_config,
            measurement,
            str(output_path),
            f"mc_subclass_{n}_rep{i}",
            source_seed=seed,
        )
        n_strata_mc[n].append(result.impact_results["data"]["impact_estimates"]["treatment_effect"])

    if (i + 1) % 5 == 0:
        print(f"Subclassification sweep: {i + 1}/{N_REPS} replications")
Subclassification sweep: 5/25 replications
Subclassification sweep: 10/25 replications
Subclassification sweep: 15/25 replications
Subclassification sweep: 20/25 replications
Subclassification sweep: 25/25 replications
[12]:
from notebook_support import plot_parameter_sensitivity_mc

strata_means = [np.mean(n_strata_mc[n]) for n in n_strata_values]
strata_stds = [np.std(n_strata_mc[n], ddof=1) for n in n_strata_values]
strata_lower = [m - s for m, s in zip(strata_means, strata_stds)]
strata_upper = [m + s for m, s in zip(strata_means, strata_stds)]

plot_parameter_sensitivity_mc(
    param_values=n_strata_values,
    mean_estimates=strata_means,
    lower_band=strata_lower,
    upper_band=strata_upper,
    true_effect=true_te,
    xlabel="Number of Strata (n_strata)",
    ylabel="Treatment Effect",
    title=f"Subclassification: n_strata Sensitivity ({N_REPS} replications)",
)
4b. Nearest Neighbour Matching: caliper
[ ]:
[ ]: