Download the notebook here!
Interactive online version: ![]()
Time Series
This notebook demonstrates interrupted time series impact estimation via statsmodels `SARIMAX() <https://www.statsmodels.org/stable/generated/statsmodels.tsa.statespace.sarimax.SARIMAX.html>`__.
Workflow overview
Generate product characteristics using the catalog simulator
Configure the engine with enrichment
Run impact evaluation
Review results
Validate against known true effect + convergence analysis
Initial setup
Import the required packages.
[1]:
from pathlib import Path

import pandas as pd
from impact_engine_measure import measure_impact, load_results
from impact_engine_measure.core.validation import load_config
from impact_engine_measure.core import apply_transform
from impact_engine_measure.models.factory import get_model_adapter
from online_retail_simulator import enrich, simulate
Step 1 — Product Catalog
In production, this would be your actual product catalog.
[2]:
output_path = Path("output/demo_interrupted_time_series")
output_path.mkdir(parents=True, exist_ok=True)

catalog_job = simulate("configs/demo_interrupted_time_series_catalog.yaml", job_id="catalog")
products = catalog_job.load_df("products")

print(f"Generated {len(products)} products")
print(f"Products catalog: {catalog_job.get_store().full_path('products.csv')}")
products.head()
Generated 500 products
Products catalog: /home/runner/work/tools-impact-engine-measure/tools-impact-engine-measure/docs/source/methods/output/demo_interrupted_time_series/catalog/products.csv
[2]:
| product_identifier | category | price | |
|---|---|---|---|
| 0 | B1P4DZHDS9 | Electronics | 686.37 |
| 1 | B1SE4QSNG7 | Toys & Games | 80.75 |
| 2 | BXTPQIDT5C | Food & Beverage | 42.02 |
| 3 | B3F1ZMC8Q6 | Food & Beverage | 33.42 |
| 4 | B2NQRBTF0Y | Toys & Games | 27.52 |
Step 2 — Engine configuration
Configure the engine with the following sections.
DATA— Where to get products and how to simulate metricsENRICHMENT— Quality boost applied to all products starting Nov 15MEASUREMENT— Interrupted time series model
[3]:
config_path = "configs/demo_interrupted_time_series.yaml"
Step 3 — Impact evaluation
Call measure_impact() with the configuration file. The engine handles the following.
Loading products
Simulating daily metrics
Aggregating data
Running the interrupted time series model
[4]:
job_info = measure_impact(config_path, str(output_path), job_id="results")
print(f"Job ID: {job_info.job_id}")
Job ID: results
Step 4 — Review results
Load and display the impact evaluation results.
[5]:
result = load_results(job_info)

data = result.impact_results["data"]
model_params = data["model_params"]
estimates = data["impact_estimates"]
summary = data["model_summary"]

print("=" * 60)
print("IMPACT EVALUATION RESULTS")
print("=" * 60)
print(f"\nModel: {result.model_type}")
print(f"Intervention Date: {model_params['intervention_date']}")
print(f"Dependent Variable: {model_params['dependent_variable']}")

print("\n--- Impact Estimates ---")
print(f"Pre-intervention mean:  ${estimates['pre_intervention_mean']:,.2f}")
print(f"Post-intervention mean: ${estimates['post_intervention_mean']:,.2f}")
print(f"Absolute change:        ${estimates['absolute_change']:,.2f}")
print(f"Percent change:         {estimates['percent_change']:.1f}%")

print("\n--- Model Summary ---")
print(f"Observations:   {summary['n_observations']}")
print(f"Pre-period:     {summary['pre_period_length']} days")
print(f"Post-period:    {summary['post_period_length']} days")

print("\n" + "=" * 60)
print("Demo Complete!")
print("=" * 60)
============================================================
IMPACT EVALUATION RESULTS
============================================================

Model: interrupted_time_series
Intervention Date: 2024-11-15
Dependent Variable: revenue

--- Impact Estimates ---
Pre-intervention mean:  $19,382.73
Post-intervention mean: $21,564.52
Absolute change:        $2,181.78
Percent change:         11.3%

--- Model Summary ---
Observations:   30
Pre-period:     14 days
Post-period:    16 days

============================================================
Demo Complete!
============================================================
Step 5 — Model validation
Compare the model’s estimate against the true causal effect computed from counterfactual vs factual data.
[6]:
def calculate_true_effect(
    baseline_metrics: pd.DataFrame,
    enriched_metrics: pd.DataFrame,
    intervention_date: str,
    metric: str = "revenue",
) -> dict:
    """Calculate TRUE causal effect by comparing factual vs counterfactual."""
    intervention = pd.Timestamp(intervention_date)

    baseline_daily = baseline_metrics.groupby("date")[metric].sum().reset_index()
    enriched_daily = enriched_metrics.groupby("date")[metric].sum().reset_index()
    baseline_daily["date"] = pd.to_datetime(baseline_daily["date"])
    enriched_daily["date"] = pd.to_datetime(enriched_daily["date"])

    baseline_post = baseline_daily[baseline_daily["date"] >= intervention][metric]
    enriched_post = enriched_daily[enriched_daily["date"] >= intervention][metric]

    baseline_mean = baseline_post.mean()
    enriched_mean = enriched_post.mean()
    absolute_effect = enriched_mean - baseline_mean
    percent_effect = (absolute_effect / baseline_mean * 100) if baseline_mean > 0 else 0

    return {
        "counterfactual_mean": float(baseline_mean),
        "factual_mean": float(enriched_mean),
        "absolute_effect": float(absolute_effect),
        "percent_effect": float(percent_effect),
    }
[7]:
baseline_metrics = catalog_job.load_df("metrics").rename(columns={"product_identifier": "product_id"})

enrich("configs/demo_interrupted_time_series_enrichment.yaml", catalog_job)
enriched_metrics = catalog_job.load_df("enriched").rename(columns={"product_identifier": "product_id"})

print(f"Baseline records: {len(baseline_metrics)}")
print(f"Enriched records: {len(enriched_metrics)}")
Baseline records: 15000
Enriched records: 15000
[8]:
true_effect = calculate_true_effect(baseline_metrics, enriched_metrics, "2024-11-15", "revenue")

true_pct = true_effect["percent_effect"]
its_pct = estimates["percent_change"]

if true_pct != 0:
    recovery_accuracy = (1 - abs(1 - its_pct / true_pct)) * 100
else:
    recovery_accuracy = 100 if its_pct == 0 else 0

print("=" * 60)
print("TRUTH RECOVERY VALIDATION")
print("=" * 60)
print(f"True effect:       {true_pct:.1f}%")
print(f"ITS estimate:      {its_pct:.1f}%")
print(f"Recovery accuracy: {max(0, recovery_accuracy):.1f}%")
print("=" * 60)
============================================================
TRUTH RECOVERY VALIDATION
============================================================
True effect:       18.2%
ITS estimate:      11.3%
Recovery accuracy: 61.9%
============================================================
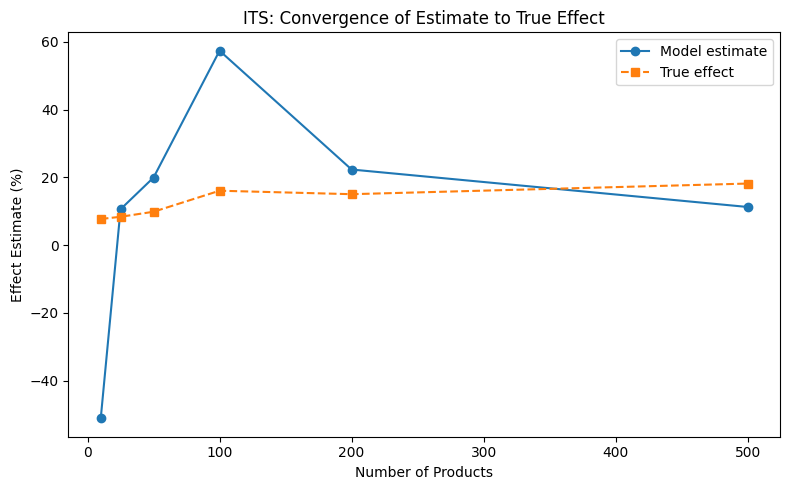
Convergence analysis
How does the estimate converge to the true effect as sample size increases?
[9]:
sample_sizes = [10, 25, 50, 100, 200, 500]
estimates_list = []
truth_list = []

parsed = load_config(config_path)
transform_config = {"FUNCTION": "aggregate_by_date", "PARAMS": {"metric": "revenue"}}
all_product_ids = enriched_metrics["product_id"].unique()
measurement_params = parsed["MEASUREMENT"]["PARAMS"]

for n in sample_sizes:
    subset_ids = all_product_ids[:n]
    enriched_sub = enriched_metrics[enriched_metrics["product_id"].isin(subset_ids)]
    baseline_sub = baseline_metrics[baseline_metrics["product_id"].isin(subset_ids)]

    true = calculate_true_effect(baseline_sub, enriched_sub, "2024-11-15", "revenue")
    truth_list.append(true["percent_effect"])

    transformed = apply_transform(enriched_sub, transform_config)
    model = get_model_adapter("interrupted_time_series")
    model.connect(measurement_params)
    result = model.fit(data=transformed, intervention_date="2024-11-15", dependent_variable="revenue")
    estimates_list.append(result.data["impact_estimates"]["percent_change"])

print("Convergence analysis complete.")
Convergence analysis complete.
[10]:
from notebook_support import plot_convergence

plot_convergence(
    sample_sizes,
    estimates_list,
    truth_list,
    xlabel="Number of Products",
    ylabel="Effect Estimate (%)",
    title="ITS: Convergence of Estimate to True Effect",
)