Download the notebook here!
Interactive online version: ![]()
Neighbour Matching
This notebook demonstrates nearest neighbour matching impact estimation via causalml `NearestNeighborMatch <https://causalml.readthedocs.io/en/latest/methodology.html#matching>`__.
The model matches treated and control units on observed covariates (price), then computes ATT (Average Treatment Effect on the Treated), ATC (on the Controls), and ATE (overall) from mean outcome differences in the matched sample.
Workflow overview
User provides
products.csvUser configures
DATA.ENRICHMENTfor treatment assignmentUser calls
measure_impact(config.yaml)Engine handles everything internally (adapter, enrichment, model)
Initial setup
[1]:
from pathlib import Path

import pandas as pd
from impact_engine_measure import measure_impact, load_results
from impact_engine_measure.core.validation import load_config
from impact_engine_measure.models.factory import get_model_adapter
from online_retail_simulator import enrich, simulate
Step 1 — Product Catalog
In production, this would be your actual product catalog.
[2]:
output_path = Path("output/demo_nearest_neighbour_matching")
output_path.mkdir(parents=True, exist_ok=True)

catalog_job = simulate("configs/demo_nearest_neighbour_matching_catalog.yaml", job_id="catalog")
products = catalog_job.load_df("products")

print(f"Generated {len(products)} products")
print(f"Products catalog: {catalog_job.get_store().full_path('products.csv')}")
products.head()
Generated 5000 products
Products catalog: /home/runner/work/tools-impact-engine-measure/tools-impact-engine-measure/docs/source/methods/output/demo_nearest_neighbour_matching/catalog/products.csv
[2]:
| product_identifier | category | price | |
|---|---|---|---|
| 0 | B1P4DZHDS9 | Electronics | 686.37 |
| 1 | B1SE4QSNG7 | Toys & Games | 80.75 |
| 2 | BXTPQIDT5C | Food & Beverage | 42.02 |
| 3 | B3F1ZMC8Q6 | Food & Beverage | 33.42 |
| 4 | B2NQRBTF0Y | Toys & Games | 27.52 |
Step 2 — Engine configuration
Configure the engine with the following sections.
ENRICHMENT— Treatment assignment via quality boost (50/50 split)MODEL—nearest_neighbour_matchingmatching onprice
Matching parameters.
caliper: 0.2— maximum allowed distance between matched pairsreplace: true— control units can be reused across matchesratio: 1— one-to-one matching
[3]:
config_path = "configs/demo_nearest_neighbour_matching.yaml"
Step 3 — Impact evaluation
A single call to measure_impact() handles everything.
Engine creates
CatalogSimulatorAdapterAdapter simulates metrics (single-day, cross-sectional)
Adapter applies enrichment (treatment assignment + revenue boost)
NearestNeighbourMatchingAdaptermatches on price, computes ATT/ATC/ATE
[4]:
job_info = measure_impact(config_path, str(output_path), job_id="results")
print(f"Job ID: {job_info.job_id}")
Job ID: results
Step 4 — Review results
[5]:
result = load_results(job_info)

data = result.impact_results["data"]
estimates = data["impact_estimates"]
summary = data["model_summary"]

print("=" * 60)
print("NEAREST NEIGHBOUR MATCHING RESULTS")
print("=" * 60)

print(f"\nModel Type: {result.model_type}")

print("\n--- Impact Estimates ---")
print(f"ATT (Avg Treatment on Treated):  {estimates['att']:.4f} (SE: {estimates['att_se']:.4f})")
print(f"ATC (Avg Treatment on Controls): {estimates['atc']:.4f} (SE: {estimates['atc_se']:.4f})")
print(f"ATE (Avg Treatment Effect):      {estimates['ate']:.4f}")

print("\n--- Matching Summary ---")
print(f"Observations:    {summary['n_observations']}")
print(f"Treated:         {summary['n_treated']}")
print(f"Control:         {summary['n_control']}")
print(f"Matched (ATT):   {summary['n_matched_att']}")
print(f"Matched (ATC):   {summary['n_matched_atc']}")
print(f"Caliper:         {summary['caliper']}")
print(f"Replace:         {summary['replace']}")
print(f"Ratio:           {summary['ratio']}")
============================================================
NEAREST NEIGHBOUR MATCHING RESULTS
============================================================

Model Type: nearest_neighbour_matching

--- Impact Estimates ---
ATT (Avg Treatment on Treated):  0.4790 (SE: 5.8816)
ATC (Avg Treatment on Controls): -5.3056 (SE: 5.3264)
ATE (Avg Treatment Effect):      -2.4133

--- Matching Summary ---
Observations:    5000
Treated:         2500
Control:         2500
Matched (ATT):   5000
Matched (ATC):   5000
Caliper:         0.2
Replace:         True
Ratio:           1
[6]:
# Covariate balance artifacts
balance_before = result.model_artifacts["balance_before"]
balance_after = result.model_artifacts["balance_after"]

print("--- Covariate Balance Before Matching ---")
print(balance_before.to_string())
print("\n--- Covariate Balance After Matching ---")
print(balance_after.to_string())

print("\n" + "=" * 60)
print("Demo Complete!")
print("=" * 60)
--- Covariate Balance Before Matching ---
           Control        Treatment      SMD
0             2500             2500
1  187.72 (294.26)  184.42 (287.40)  -0.0113

--- Covariate Balance After Matching ---
           Control        Treatment   SMD
0             2500             2500
1  184.42 (287.43)  184.42 (287.40)  -0.0

============================================================
Demo Complete!
============================================================
Step 5 — Model validation
Compare the model’s ATT estimate against the true causal effect computed from counterfactual vs factual data.
[7]:
def calculate_true_effect(
    baseline_metrics: pd.DataFrame,
    enriched_metrics: pd.DataFrame,
) -> dict:
    """Calculate TRUE ATT by comparing per-product revenue for treated products."""
    treated_ids = enriched_metrics[enriched_metrics["enriched"]]["product_id"].unique()

    enriched_treated = enriched_metrics[enriched_metrics["product_id"].isin(treated_ids)]
    baseline_treated = baseline_metrics[baseline_metrics["product_id"].isin(treated_ids)]

    enriched_mean = enriched_treated.groupby("product_id")["revenue"].mean().mean()
    baseline_mean = baseline_treated.groupby("product_id")["revenue"].mean().mean()
    treatment_effect = enriched_mean - baseline_mean

    return {
        "enriched_mean": float(enriched_mean),
        "baseline_mean": float(baseline_mean),
        "treatment_effect": float(treatment_effect),
    }
[8]:
baseline_metrics = catalog_job.load_df("metrics").rename(columns={"product_identifier": "product_id"})

enrich("configs/demo_nearest_neighbour_matching_enrichment.yaml", catalog_job)
enriched_metrics = catalog_job.load_df("enriched").rename(columns={"product_identifier": "product_id"})

print(f"Baseline records: {len(baseline_metrics)}")
print(f"Enriched records: {len(enriched_metrics)}")
Baseline records: 5000
Enriched records: 5000
[9]:
true_effect = calculate_true_effect(baseline_metrics, enriched_metrics)

true_te = true_effect["treatment_effect"]
model_te = estimates["att"]

if true_te != 0:
    recovery_accuracy = (1 - abs(1 - model_te / true_te)) * 100
else:
    recovery_accuracy = 100 if model_te == 0 else 0

print("=" * 60)
print("TRUTH RECOVERY VALIDATION")
print("=" * 60)
print(f"True treatment effect:  {true_te:.4f}")
print(f"Model ATT estimate:     {model_te:.4f}")
print(f"Recovery accuracy:      {max(0, recovery_accuracy):.1f}%")
print("=" * 60)
============================================================
TRUTH RECOVERY VALIDATION
============================================================
True treatment effect:  0.0000
Model ATT estimate:     0.4790
Recovery accuracy:      0.0%
============================================================
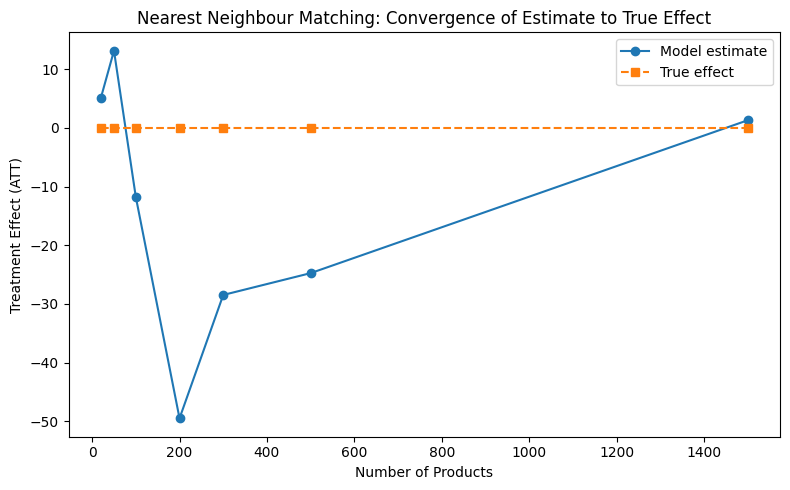
Convergence analysis
How does the estimate converge to the true effect as sample size increases?
[10]:
sample_sizes = [20, 50, 100, 200, 300, 500, 1500]
estimates_list = []
truth_list = []

parsed = load_config(config_path)
measurement_config = parsed["MEASUREMENT"]
all_product_ids = enriched_metrics["product_id"].unique()

for n in sample_sizes:
    subset_ids = all_product_ids[:n]
    enriched_sub = enriched_metrics[enriched_metrics["product_id"].isin(subset_ids)]
    baseline_sub = baseline_metrics[baseline_metrics["product_id"].isin(subset_ids)]

    true = calculate_true_effect(baseline_sub, enriched_sub)
    truth_list.append(true["treatment_effect"])

    model = get_model_adapter("nearest_neighbour_matching")
    model.connect(measurement_config["PARAMS"])
    result = model.fit(data=enriched_sub, dependent_variable="revenue")
    estimates_list.append(result.data["impact_estimates"]["att"])

print("Convergence analysis complete.")
Convergence analysis complete.
[11]:
from notebook_support import plot_convergence

plot_convergence(
    sample_sizes,
    estimates_list,
    truth_list,
    xlabel="Number of Products",
    ylabel="Treatment Effect (ATT)",
    title="Nearest Neighbour Matching: Convergence of Estimate to True Effect",
)