Download the notebook here!
Interactive online version: ![]()
Covariate Stratification
This notebook demonstrates subclassification (stratification) impact estimation via pandas qcut() and NumPy np.average().
Subclassification stratifies observations into strata based on covariate quantiles, computes within-stratum treatment effects, and aggregates via weighted average.
Workflow overview
User provides
products.csvUser configures
DATA.ENRICHMENTfor treatment assignmentUser calls
measure_impact(config.yaml)Engine handles everything internally (adapter, enrichment, model)
Initial setup
[1]:
from pathlib import Path

import pandas as pd
from impact_engine_measure import measure_impact, load_results
from impact_engine_measure.core.validation import load_config
from impact_engine_measure.models.factory import get_model_adapter
from online_retail_simulator import enrich, simulate
Step 1 — Product Catalog
In production, this would be your actual product catalog.
[2]:
output_path = Path("output/demo_subclassification")
output_path.mkdir(parents=True, exist_ok=True)

catalog_job = simulate("configs/demo_subclassification_catalog.yaml", job_id="catalog")
products = catalog_job.load_df("products")

print(f"Generated {len(products)} products")
print(f"Products catalog: {catalog_job.get_store().full_path('products.csv')}")
products.head()
Generated 5000 products
Products catalog: /home/runner/work/tools-impact-engine-measure/tools-impact-engine-measure/docs/source/methods/output/demo_subclassification/catalog/products.csv
[2]:
| product_identifier | category | price | |
|---|---|---|---|
| 0 | B1P4DZHDS9 | Electronics | 686.37 |
| 1 | B1SE4QSNG7 | Toys & Games | 80.75 |
| 2 | BXTPQIDT5C | Food & Beverage | 42.02 |
| 3 | B3F1ZMC8Q6 | Food & Beverage | 33.42 |
| 4 | B2NQRBTF0Y | Toys & Games | 27.52 |
Step 2 — Engine configuration
Configure the engine with the following sections.
ENRICHMENT— Treatment assignment via quality boost (50/50 split)MODEL—subclassificationwith price as covariate
Single-day simulation (start_date = end_date) produces cross-sectional data required by subclassification.
[3]:
config_path = "configs/demo_subclassification.yaml"
Step 3 — Impact evaluation
A single call to measure_impact() handles everything.
Engine creates
CatalogSimulatorAdapterAdapter simulates metrics (single-day, cross-sectional)
Adapter applies enrichment (treatment assignment + revenue boost)
SubclassificationAdapterstratifies on price, computes per-stratum effects
[4]:
job_info = measure_impact(config_path, str(output_path), job_id="results")
print(f"Job ID: {job_info.job_id}")
Job ID: results
Step 4 — Review results
[5]:
result = load_results(job_info)

data = result.impact_results["data"]
estimates = data["impact_estimates"]
summary = data["model_summary"]

print("=" * 60)
print("SUBCLASSIFICATION IMPACT ESTIMATION RESULTS")
print("=" * 60)

print(f"\nModel Type: {result.model_type}")
print(f"Estimand:   {summary['estimand']}")

print("\n--- Impact Estimates ---")
print(f"Treatment Effect:    {estimates['treatment_effect']:.4f}")
print(f"Strata Used:         {estimates['n_strata']}")
print(f"Strata Dropped:      {estimates['n_strata_dropped']}")

print("\n--- Model Summary ---")
print(f"Observations:        {summary['n_observations']}")
print(f"Treated:             {summary['n_treated']}")
print(f"Control:             {summary['n_control']}")
============================================================
SUBCLASSIFICATION IMPACT ESTIMATION RESULTS
============================================================

Model Type: subclassification
Estimand:   att

--- Impact Estimates ---
Treatment Effect:    2.8377
Strata Used:         5
Strata Dropped:      0

--- Model Summary ---
Observations:        5000
Treated:             2500
Control:             2500
[6]:
# Per-stratum details from model artifacts
stratum_df = result.model_artifacts["stratum_details"]

print("--- Per-Stratum Breakdown ---")
print("-" * 70)
print(f"{'Stratum':<10} {'Treated':<10} {'Control':<10} {'Mean T':<12} {'Mean C':<12} {'Effect':<12}")
print("-" * 70)
for _, row in stratum_df.iterrows():
    print(
        f"{row['stratum']:<10} {row['n_treated']:<10} {row['n_control']:<10} "
        f"{row['mean_treated']:<12.2f} {row['mean_control']:<12.2f} {row['effect']:<12.2f}"
    )

print("\n" + "=" * 60)
print("Demo Complete!")
print("=" * 60)
--- Per-Stratum Breakdown ---
----------------------------------------------------------------------
Stratum    Treated    Control    Mean T       Mean C       Effect
----------------------------------------------------------------------
0          484        517        5.30         4.06         1.23
1          504        496        7.91         8.96         -1.05
2          519        480        13.56        15.50        -1.94
3          503        497        29.73        47.17        -17.44
4          490        510        149.12       114.82       34.30

============================================================
Demo Complete!
============================================================
Step 5 — Model validation
Compare the model’s estimate against the true causal effect computed from counterfactual vs factual data.
[7]:
def calculate_true_effect(
    baseline_metrics: pd.DataFrame,
    enriched_metrics: pd.DataFrame,
) -> dict:
    """Calculate TRUE ATT by comparing per-product revenue for treated products."""
    treated_ids = enriched_metrics[enriched_metrics["enriched"]]["product_id"].unique()

    enriched_treated = enriched_metrics[enriched_metrics["product_id"].isin(treated_ids)]
    baseline_treated = baseline_metrics[baseline_metrics["product_id"].isin(treated_ids)]

    enriched_mean = enriched_treated.groupby("product_id")["revenue"].mean().mean()
    baseline_mean = baseline_treated.groupby("product_id")["revenue"].mean().mean()
    treatment_effect = enriched_mean - baseline_mean

    return {
        "enriched_mean": float(enriched_mean),
        "baseline_mean": float(baseline_mean),
        "treatment_effect": float(treatment_effect),
    }
[8]:
baseline_metrics = catalog_job.load_df("metrics").rename(columns={"product_identifier": "product_id"})

enrich("configs/demo_subclassification_enrichment.yaml", catalog_job)
enriched_metrics = catalog_job.load_df("enriched").rename(columns={"product_identifier": "product_id"})

print(f"Baseline records: {len(baseline_metrics)}")
print(f"Enriched records: {len(enriched_metrics)}")
Baseline records: 5000
Enriched records: 5000
[9]:
true_effect = calculate_true_effect(baseline_metrics, enriched_metrics)

true_te = true_effect["treatment_effect"]
model_te = estimates["treatment_effect"]

if true_te != 0:
    recovery_accuracy = (1 - abs(1 - model_te / true_te)) * 100
else:
    recovery_accuracy = 100 if model_te == 0 else 0

print("=" * 60)
print("TRUTH RECOVERY VALIDATION")
print("=" * 60)
print(f"True treatment effect:  {true_te:.4f}")
print(f"Model estimate:         {model_te:.4f}")
print(f"Recovery accuracy:      {max(0, recovery_accuracy):.1f}%")
print("=" * 60)
============================================================
TRUTH RECOVERY VALIDATION
============================================================
True treatment effect:  0.0000
Model estimate:         2.8377
Recovery accuracy:      0.0%
============================================================
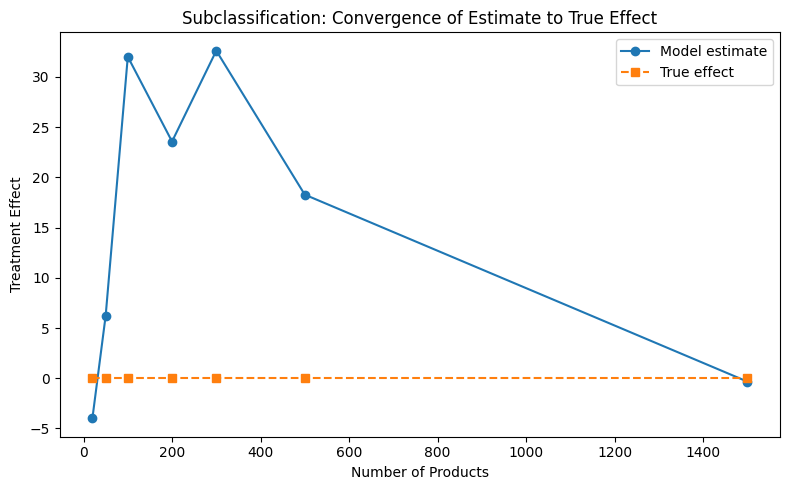
Convergence analysis
How does the estimate converge to the true effect as sample size increases?
[10]:
sample_sizes = [20, 50, 100, 200, 300, 500, 1500]
estimates_list = []
truth_list = []

parsed = load_config(config_path)
measurement_config = parsed["MEASUREMENT"]
all_product_ids = enriched_metrics["product_id"].unique()

for n in sample_sizes:
    subset_ids = all_product_ids[:n]
    enriched_sub = enriched_metrics[enriched_metrics["product_id"].isin(subset_ids)]
    baseline_sub = baseline_metrics[baseline_metrics["product_id"].isin(subset_ids)]

    true = calculate_true_effect(baseline_sub, enriched_sub)
    truth_list.append(true["treatment_effect"])

    model = get_model_adapter("subclassification")
    model.connect(measurement_config["PARAMS"])
    result = model.fit(data=enriched_sub)
    estimates_list.append(result.data["impact_estimates"]["treatment_effect"])

print("Convergence analysis complete.")
Convergence analysis complete.
[11]:
from notebook_support import plot_convergence

plot_convergence(
    sample_sizes,
    estimates_list,
    truth_list,
    xlabel="Number of Products",
    ylabel="Treatment Effect",
    title="Subclassification: Convergence of Estimate to True Effect",
)