Download the notebook here!
Interactive online version: ![]()
Linear Regression
This notebook demonstrates experiment-based impact estimation via statsmodels `ols() <https://www.statsmodels.org/stable/generated/statsmodels.formula.api.ols.html>`__.
The experiment model fits an OLS regression with an R-style formula. The enriched indicator acts as the treatment variable, and the coefficient on enriched estimates the average treatment effect.
Workflow overview
User provides
products.csvUser configures
DATA.ENRICHMENTfor treatment assignmentUser calls
measure_impact(config.yaml)Engine handles everything internally (adapter, enrichment, model)
Initial setup
[1]:
from pathlib import Path

import pandas as pd
from impact_engine_measure import measure_impact, load_results
from impact_engine_measure.core.validation import load_config
from impact_engine_measure.models.factory import get_model_adapter
from online_retail_simulator import enrich, simulate
Step 1 — Product Catalog
In production, this would be your actual product catalog.
[2]:
output_path = Path("output/demo_experiment")
output_path.mkdir(parents=True, exist_ok=True)

catalog_job = simulate("configs/demo_experiment_catalog.yaml", job_id="catalog")
products = catalog_job.load_df("products")

print(f"Generated {len(products)} products")
print(f"Products catalog: {catalog_job.get_store().full_path('products.csv')}")
products.head()
Generated 5000 products
Products catalog: /home/runner/work/tools-impact-engine-measure/tools-impact-engine-measure/docs/source/methods/output/demo_experiment/catalog/products.csv
[2]:
| product_identifier | category | price | |
|---|---|---|---|
| 0 | B1P4DZHDS9 | Electronics | 686.37 |
| 1 | B1SE4QSNG7 | Toys & Games | 80.75 |
| 2 | BXTPQIDT5C | Food & Beverage | 42.02 |
| 3 | B3F1ZMC8Q6 | Food & Beverage | 33.42 |
| 4 | B2NQRBTF0Y | Toys & Games | 27.52 |
Step 2 — Engine configuration
Configure the engine with the following sections.
ENRICHMENT— Treatment assignment via quality boost (50/50 split)MODEL—experimentwith formularevenue ~ enriched + price
The formula specifies an OLS regression where revenue is the outcome, enriched is the treatment indicator, and price is a control variable. The coefficient on enriched estimates the treatment effect.
[3]:
config_path = "configs/demo_experiment.yaml"
Step 3 — Impact evaluation
A single call to measure_impact() handles everything.
Engine creates
CatalogSimulatorAdapterAdapter simulates metrics (single-day, cross-sectional)
Adapter applies enrichment (treatment assignment + revenue boost)
ExperimentAdapterfits OLS regression with the specified formula
[4]:
job_info = measure_impact(config_path, str(output_path), job_id="results")
print(f"Job ID: {job_info.job_id}")
Job ID: results
Step 4 — Review results
[5]:
results = load_results(job_info)

data = results.impact_results["data"]
model_params = data["model_params"]
estimates = data["impact_estimates"]
summary = data["model_summary"]

print("=" * 60)
print("EXPERIMENT (OLS REGRESSION) RESULTS")
print("=" * 60)

print(f"\nFormula: {model_params['formula']}")
print(f"R-squared: {summary['rsquared']:.4f}")
print(f"R-squared (adj): {summary['rsquared_adj']:.4f}")
print(f"F-statistic: {summary['fvalue']:.2f} (p={summary['f_pvalue']:.4e})")
print(f"Observations: {summary['nobs']}")

print("\n--- Coefficients ---")
print("-" * 70)
print(f"{'Variable':<15} {'Coef':<12} {'Std Err':<12} {'P-value':<12} {'95% CI'}")
print("-" * 70)
for var in estimates["params"]:
    coef = estimates["params"][var]
    se = estimates["bse"][var]
    pval = estimates["pvalues"][var]
    ci = estimates["conf_int"][var]
    print(f"{var:<15} {coef:<12.4f} {se:<12.4f} {pval:<12.4e} [{ci[0]:.4f}, {ci[1]:.4f}]")

print("\n" + "=" * 60)
print(
    f"Treatment effect (enriched coefficient): {estimates['params'].get('enriched[T.True]', estimates['params'].get('enriched', 'N/A'))}"
)
print("=" * 60)
============================================================
EXPERIMENT (OLS REGRESSION) RESULTS
============================================================

Formula: revenue ~ enriched + price
R-squared: 0.0739
R-squared (adj): 0.0735
F-statistic: 199.36 (p=5.0325e-84)
Observations: 5000

--- Coefficients ---
----------------------------------------------------------------------
Variable        Coef         Std Err      P-value      95% CI
----------------------------------------------------------------------
Intercept       1.8661       4.4065       6.7195e-01   [-6.7725, 10.5047]
enriched[T.True] 2.8913       5.6691       6.1007e-01   [-8.2227, 14.0052]
price           0.1946       0.0097       2.2423e-85   [0.1755, 0.2137]

============================================================
Treatment effect (enriched coefficient): 2.891284272445194
============================================================
Step 5 — Model validation
Compare the model’s estimate against the true causal effect computed from counterfactual vs factual data.
[6]:
def calculate_true_effect(
    baseline_metrics: pd.DataFrame,
    enriched_metrics: pd.DataFrame,
) -> dict:
    """Calculate TRUE ATT by comparing per-product revenue for treated products."""
    treated_ids = enriched_metrics[enriched_metrics["enriched"]]["product_id"].unique()

    enriched_treated = enriched_metrics[enriched_metrics["product_id"].isin(treated_ids)]
    baseline_treated = baseline_metrics[baseline_metrics["product_id"].isin(treated_ids)]

    enriched_mean = enriched_treated.groupby("product_id")["revenue"].mean().mean()
    baseline_mean = baseline_treated.groupby("product_id")["revenue"].mean().mean()
    treatment_effect = enriched_mean - baseline_mean

    return {
        "enriched_mean": float(enriched_mean),
        "baseline_mean": float(baseline_mean),
        "treatment_effect": float(treatment_effect),
    }
[7]:
baseline_metrics = catalog_job.load_df("metrics").rename(columns={"product_identifier": "product_id"})

enrich("configs/demo_experiment_enrichment.yaml", catalog_job)
enriched_metrics = catalog_job.load_df("enriched").rename(columns={"product_identifier": "product_id"})

print(f"Baseline records: {len(baseline_metrics)}")
print(f"Enriched records: {len(enriched_metrics)}")
Baseline records: 5000
Enriched records: 5000
[8]:
true_effect = calculate_true_effect(baseline_metrics, enriched_metrics)

true_te = true_effect["treatment_effect"]
# The enriched coefficient name depends on how statsmodels encodes the boolean
model_te = estimates["params"].get("enriched[T.True]", estimates["params"].get("enriched", 0))

if true_te != 0:
    recovery_accuracy = (1 - abs(1 - model_te / true_te)) * 100
else:
    recovery_accuracy = 100 if model_te == 0 else 0

print("=" * 60)
print("TRUTH RECOVERY VALIDATION")
print("=" * 60)
print(f"True treatment effect:  {true_te:.4f}")
print(f"Model estimate:         {model_te:.4f}")
print(f"Recovery accuracy:      {max(0, recovery_accuracy):.1f}%")
print("=" * 60)
============================================================
TRUTH RECOVERY VALIDATION
============================================================
True treatment effect:  0.0000
Model estimate:         2.8913
Recovery accuracy:      0.0%
============================================================
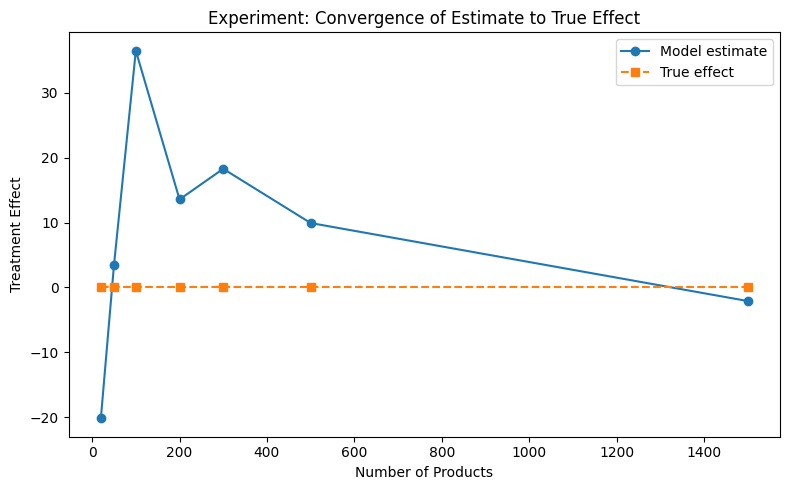
Convergence analysis
How does the estimate converge to the true effect as sample size increases?
[9]:
sample_sizes = [20, 50, 100, 200, 300, 500, 1500]
estimates_list = []
truth_list = []

parsed = load_config(config_path)
measurement_config = parsed["MEASUREMENT"]
all_product_ids = enriched_metrics["product_id"].unique()

for n in sample_sizes:
    subset_ids = all_product_ids[:n]
    enriched_sub = enriched_metrics[enriched_metrics["product_id"].isin(subset_ids)]
    baseline_sub = baseline_metrics[baseline_metrics["product_id"].isin(subset_ids)]

    true = calculate_true_effect(baseline_sub, enriched_sub)
    truth_list.append(true["treatment_effect"])

    model = get_model_adapter("experiment")
    model.connect(measurement_config["PARAMS"])
    result = model.fit(data=enriched_sub)
    coef = result.data["impact_estimates"]["params"]
    te = coef.get("enriched[T.True]", coef.get("enriched", 0))
    estimates_list.append(te)

print("Convergence analysis complete.")
Convergence analysis complete.
[10]:
from notebook_support import plot_convergence

plot_convergence(
    sample_sizes,
    estimates_list,
    truth_list,
    xlabel="Number of Products",
    ylabel="Treatment Effect",
    title="Experiment: Convergence of Estimate to True Effect",
)